Topo.ly – Measuring and Using Data to the Fullest
Last year presented a great deal about Big Data. This year, many businesses will be investing more on analytic tools to uncover their data. Topo.ly will help demystify data with its vivid data visualizations through mapping. Here’s how.
Naperville, IL, January 16, 2013 --(PR.com)-- The year 2012 was all about Big Data. It is a popular belief that around 23% of data is untagged and unanalyzed. With this, more and more companies have quickly resorted into full data analysis. One of the best tools used not only by Fortune 500 companies but also by small and start up businesses is Topo.ly Mapping.
Topo.ly was developed with features packed with simplicity of use to help organizations measure and use data to the fullest. Benjamin B. from the University of Maine Facilities Management says, “This is a powerful tool for anyone trying to manage a large number of mapping points! Other mapping systems on the web just don’t compare–Topo.ly is where it’s at!”
Topo.ly – Smart Data Analytical Tool
Using data analytics is not just an instant surge to keep pace with the trend. The challenge to measure and use data is huge and every company must do something about it. With Topo.ly as a data analytic tool, companies can now take advantage of the exceptional features for understanding and using their own data to their own advantage. What makes Topo.ly preferred by many businesses are some of its outstanding features such as:
Ability to save unlimited data sets
Data saved from Microsoft Excel spreadsheets can turn into unique maps for data visualization. Data generated about customers, locations, suppliers and even competitors can be turned into an interesting map one and the same. From just one glance, one can immediately figure out how one data set can be related to the others. With this feature, data analysis can be done in half the time.
Ability to create instant heat maps
Heat maps by Topo.ly can be created within minutes. Topo.ly offers wide choices of territory layers and heat mapping options to fulfill the users’ needs. It does not limit analysis within US boundaries. Rather, it extends its territories worldwide. This way, analyzing the business by location density or sales can be done on a global scale.
Affordable
Topo.ly uses only the best features that most businesses can afford. It even allows users to create maps for free. With its plus features at only $20 a month, one can visualize his data and do mapping at an even better level.
This 2013, we expect to see more data visualization and techniques. But with Topo.ly Mapping around, we can expect data to be analyzed and visualized in the quickest time possible.
Contact
Gapsnap, Inc.
Miranda Dixon
(630) 909-9108
http://topo.ly
Miranda Dixon
(630) 909-9108
http://topo.ly
Multimedia
Data Visualization Through Mapping
Topo.ly's easy navigation feature is a big help for both newbies and experienced businessmen to drive analysis faster.
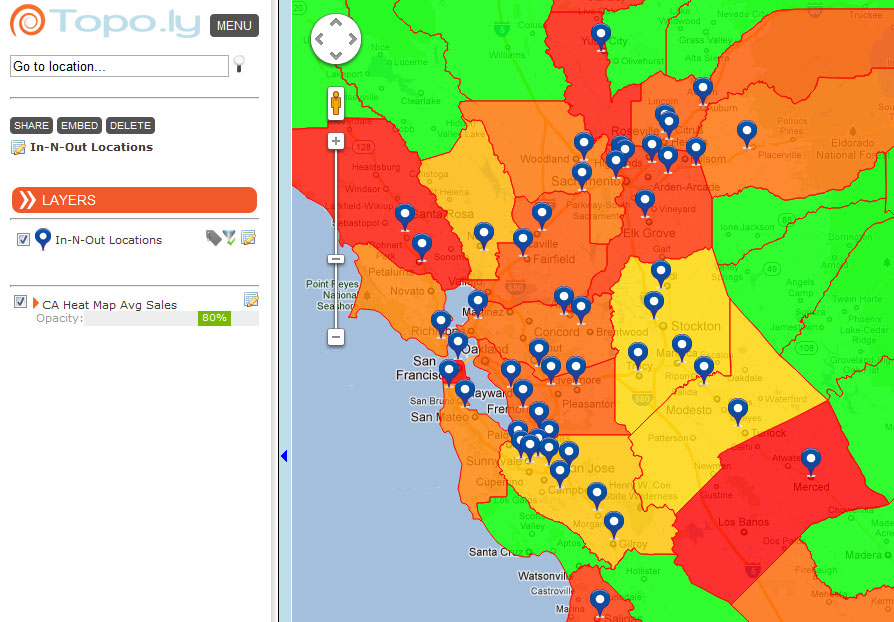
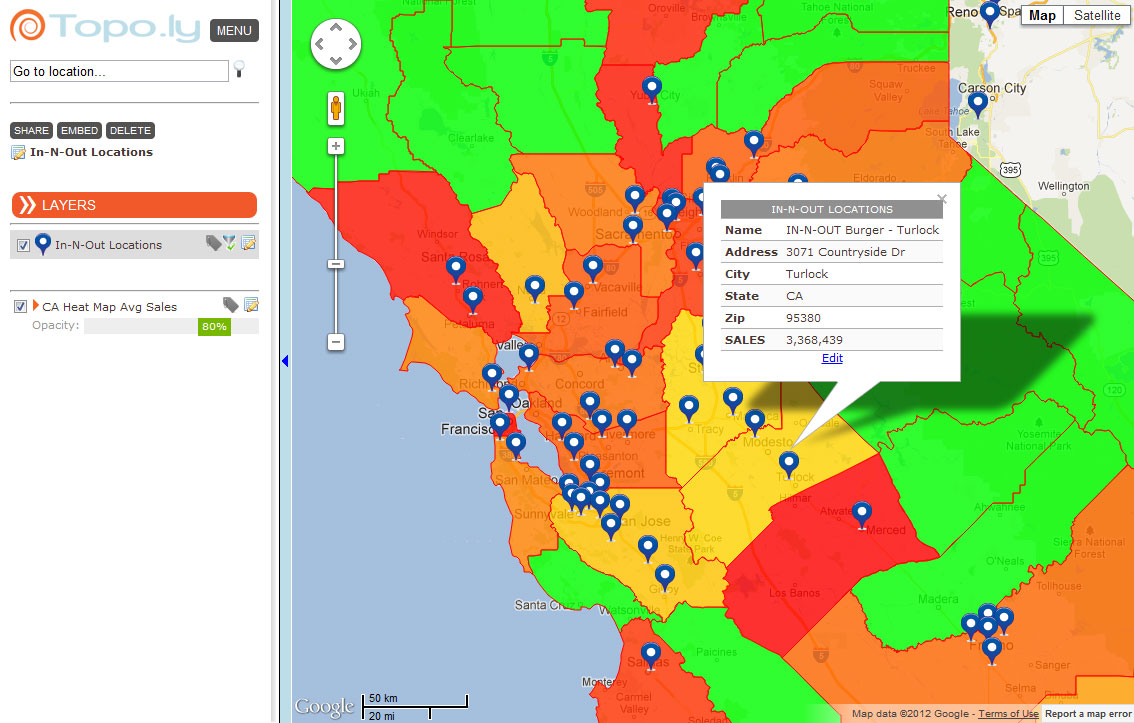
Heat Mapping
An exceptional tool for business process in terms of sales, customers’ needs, supplies, and others
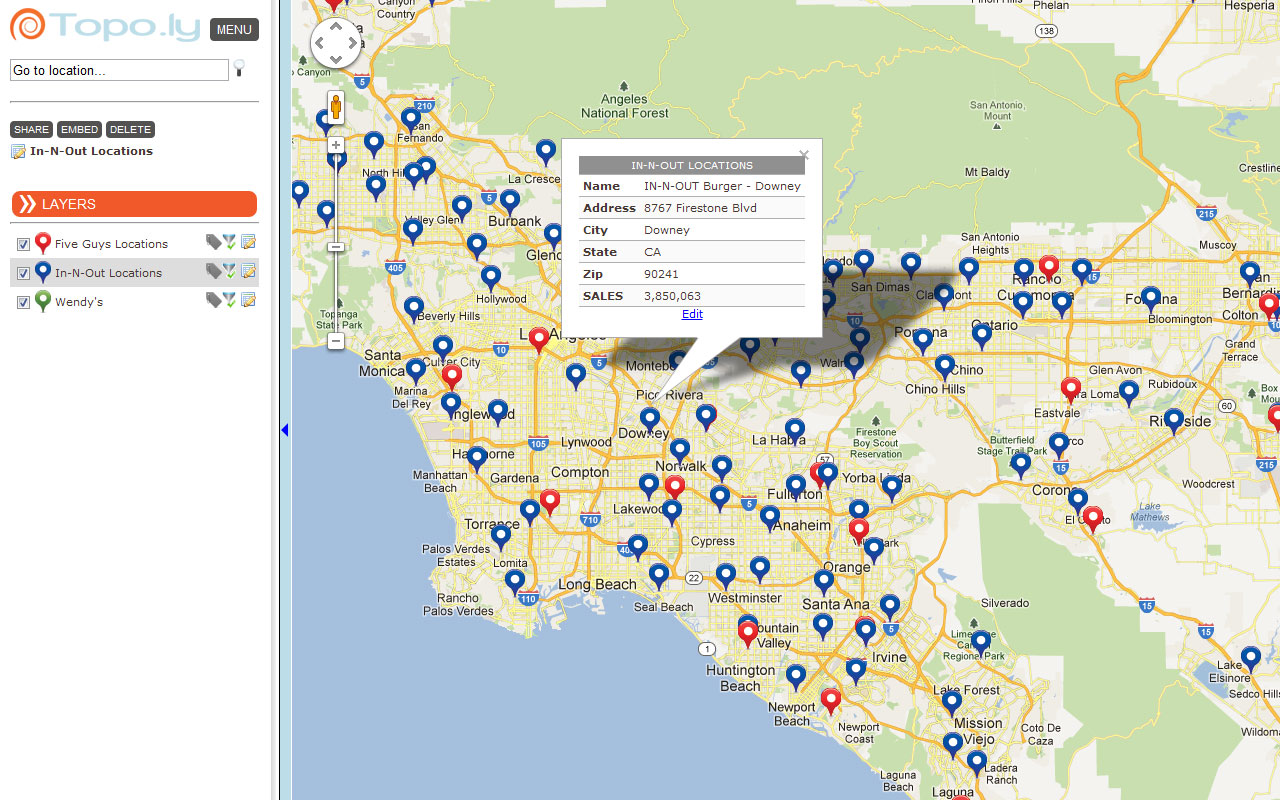
Add Multiple Layers with Unique Icons to a Map
Topo.ly easily enables users to add multiple layers of data to a map and give each data set layer a different color icon.
Categories